MTR: Advanced Network Monitoring
In the realm of networking, tackling connectivity challenges can often feel daunting.
One of the go-to utilities for tracing the journey of data across networks is the traceroute command.
Although traceroute serves its purpose well, it falls short in certain areas, particularly when it comes to offering only brief, one-time insights without the ability for ongoing observation.
This is where Matt’s Traceroute, or MTR, steps in as a superior solution.
MTR merges the functionalities of traceroute with enhanced real-time analysis, delivering a more dynamic and informative experience.
For network professionals, including administrators and engineers, MTR is a crucial tool, providing a continuous overview of network routes and performance metrics.
This real-time feedback makes it indispensable for identifying routing issues, latency problems, and packet loss occurrences.
MTR operates by integrating the capabilities of both ping and traceroute, offering a more visually appealing and accessible display compared to traditional command-line tools.
Most network administrators are well-acquainted with ping and traceroute, frequently utilizing them for swift diagnostics regarding connectivity or device accessibility.
Whether you are addressing issues on a local network or troubleshooting with your internet service provider, MTR presents a more thorough and user-friendly alternative to classic traceroute.
This discussion will explore the workings of MTR, highlight its benefits over standard tools, and provide guidance on how to leverage it effectively to enhance network performance and resolve connectivity dilemmas.
Ping is a widely utilized tool for network diagnostics, essential for troubleshooting connectivity issues.
This utility enables users to transmit ICMP packets between computers.
When a packet reaches the intended device, it sends back an ICMP echo reply.
This response serves as an indication of the device's accessibility.
If there is no reply from the computer, it suggests that the device is offline or unreachable.
Ping can also be used with hostnames, enabling the monitoring of DNS connectivity.
Network administrators frequently rely on this tool to assess the status of various hosts within a network.
However, it’s crucial to understand that ping may not always provide accurate results.
Firewalls can filter ICMP packets, leading to situations where operational devices fail to respond.
For those interested, there are numerous ping monitoring tools available that can enhance this process.
Traceroute is a popular networking utility that maps the path data packets take from a sender to a receiver. Unlike ping, which simply checks if a device is reachable, traceroute provides detailed insights into each step along the route, including the time it takes for packets to navigate through various hops.
This tool is essential for troubleshooting network issues, as it can highlight delays at specific hops. A significant delay at any point in the route often indicates a potential problem in the network. To initiate a traceroute, users just need to input the appropriate command.
The way traceroute functions involves sending Internet Control Message Protocol (ICMP) packets with a designated time to live (TTL) value. Each packet contains a TTL field that determines the maximum number of hops allowed before the packet is discarded. Once the TTL limit is reached, routers will drop the packet and inform the original sender with a timeout message.
By analyzing the TTL and the corresponding timeout responses, users can calculate the time taken for packets to travel between hops. The output of a traceroute displays the travel time in milliseconds (ms) for each segment, making it a valuable tool for assessing network latency.
A longer travel time through any hop indicates increased latency, which signals to network managers that the network may not be functioning optimally. Traceroute is typically pre-installed on both Windows and Unix systems, but it can also be downloaded and installed separately.
In contrast, MTR (My Traceroute) is a more advanced network monitoring tool that integrates the features of both ping and traceroute. MTR not only tracks the availability of network devices but also analyzes the time it takes for packets to move from hop to hop.
What distinguishes MTR from simpler tools is its ability to monitor packet loss and jitter, thereby providing a comprehensive assessment of connection quality, transfer times, and packet loss percentages.
When utilizing MTR, users can generate reports that compile performance metrics from the network. These reports present data in an organized table format on-screen, detailing aspects such as packet loss and latency for easier analysis.MTR, or My Traceroute, serves as a powerful networking tool that merges the functionalities of ping and traceroute.
It effectively assesses the availability of network devices while also monitoring the route data takes through the network.
One of MTR's standout features is its continuous output capability, unlike traditional traceroute, which requires manual updates to reflect changes in network performance over time.
With MTR, users can keep their monitoring active until they choose to halt it, enhancing their ability to troubleshoot issues as they arise.
This versatile tool is compatible with various operating systems, including Windows, macOS, and Linux, each with its unique installation methods.
For Windows users, MTR can be accessed by downloading WinMTR from the designated link.
On macOS, installation can be achieved through package managers like Homebrew or MacPorts.
To install via Homebrew, simply enter the command:
brew install mtr
If you prefer MacPorts, use this command instead:
port install mtr
Linux users have a range of distributions to choose from, such as Debian, Ubuntu, CentOS, RHEL, and Fedora.
For Debian and Ubuntu, the installation commands are:
apt update && apt upgradeapt install mtr-tiny
For CentOS, RHEL, and Fedora, you can install MTR by executing:
yum updateyum install mtr
When utilizing the MTR network scanner, generating an MTR report is crucial for analyzing your traffic data.
Since MTR reports are directional, it's essential to create reports in both directions to obtain a comprehensive view of network performance.
In this guide, we’ll cover:
- How to create and interpret MTR reports
- Assessing packet loss
- Measuring latency
- Evaluating jitter
To initiate your analysis, input the desired domain name in the host field and click start .
Packet transmission will commence and continue until you hit the stop button.
The main interface will display packet data, including the number of packets sent, received, and the percentage of packet loss.
If you’re using the command-line interface on Linux, you can generate a report by entering:
mtr
For instance:
mtr google.com
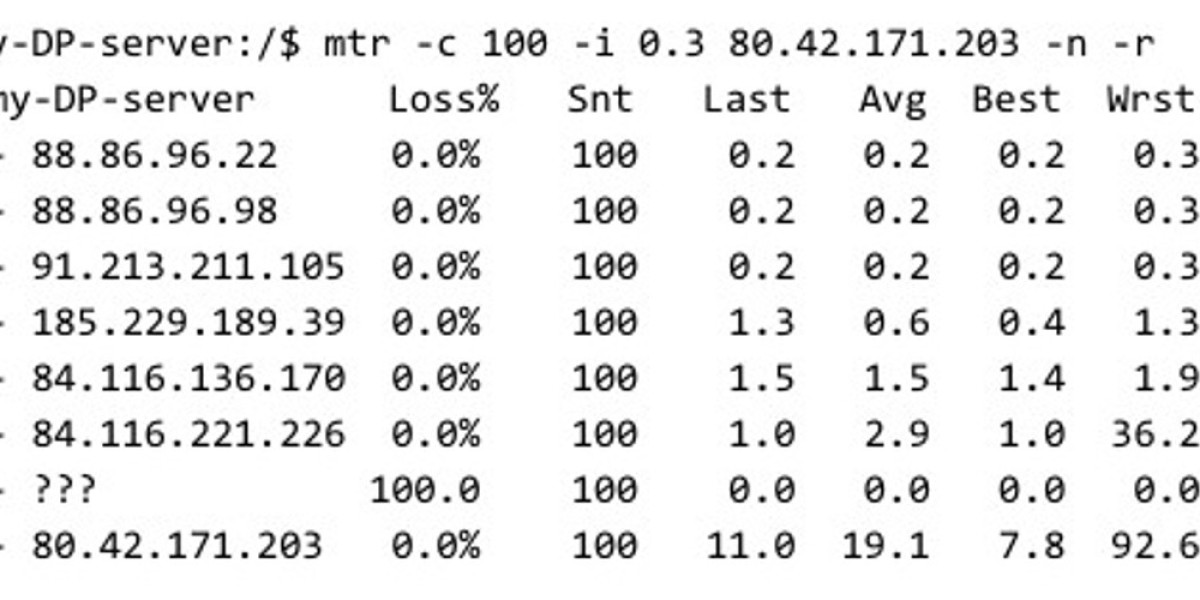
Understanding the MTR network scanner involves interpreting the report results effectively.
When you execute a report command, such as targeting google.com, it provides various insights into the network performance.
Key elements of the report include:
-
The left column displays numbered hops, indicating the paths taken.
-
Next to these numbers, you will find the corresponding host names being contacted.
-
The packet loss percentage can be found in the loss % column.
-
The snt column indicates the total packets sent.
-
For latency, the report provides several metrics:
- "last" shows the latency for the most recent packet,
- "avg" indicates the average latency,
- "best" represents the minimum round-trip time,
- "worst" signifies the maximum round-trip time for the packets sent.
When assessing packet loss with the MTR tool, focus on the values under the loss % section.
However, it's crucial to be aware of the concept of limiting, which occurs when internet service providers impose caps on ICMP traffic generated by MTR.
This rate limiting is implemented by providers to manage and prioritize other types of network traffic. As a result, you might observe packet loss that doesn't stem from any network configuration issues, but rather from these imposed limitations.
To identify potential traffic limiting, compare packet loss across different hops. If you notice significant packet loss at one hop while others show 0%, it’s likely that MTR is being restricted.
As a rule of thumb, if you encounter varying packet loss rates, it’s best to rely on the data from the later hops.
For effective troubleshooting of network issues, it's important to measure packet loss in both directions. This approach will help determine whether the problem lies in the outbound route or the return route.
Network Diagnosis Tools Overview
MTR, or My Traceroute, is a powerful network diagnostic tool that provides critical insights into network performance, particularly latency.
Understanding latency is essential, and MTR allows you to analyze this by examining various metrics within its reports.
When reviewing an MTR report, it’s crucial to focus on the hop numbers alongside the latency statistics, including the minimum, average, maximum, and the last recorded latencies for each hop.
A significant spike in latency between two hops can signal potential issues within that segment of the network, but it’s important to note that latency can originate from either the outbound or return paths.
While the report itself won’t display the return route details, you can infer potential problems by comparing the latency of the last hop with the one preceding it, prompting the need for additional troubleshooting measures.
In addition to latency, MTR can also gauge jitter, although this metric won’t appear on the standard report view. To access jitter data, you must utilize specific command options.
For instance, using the command with options like -order allows you to customize the fields displayed in your report. The available fields include:
- l – loss ratio
- d – dropped packets
- r – received packets
- s – sent packets
- n – newest round-trip time (RTT) in milliseconds
- b – minimum/best RTT
- a – average RTT
- w – maximum/worst RTT
- v – standard deviation
- g – geometric mean
- j – current jitter
- m – jitter mean/average
- x – worst jitter
- i – interarrival jitter
While MTR is a dependable tool for network analysis, several alternative tools have emerged, building upon the foundational concept of traceroute. In the following sections, we will explore some of these alternative solutions to enhance your network monitoring capabilities.
SolarWinds Traceroute NG serves as a robust alternative to traditional MTR network scanners and traceroute utilities. This software not only identifies alterations in network pathways but also enables ongoing monitoring for enhanced operational awareness.
Key Attributes:
-
User-friendly installation process
-
Clear and concise interface
-
Standard traceroute capabilities
-
Options for TCP and ICMP monitoring
-
Completely free of charge
This utility operates within a Windows environment, eliminating the need for command line navigation. Its lightweight design ensures minimal impact on system performance, making it suitable for analyzing both local and remote network paths.
Through its command line interface (CLI), users can access essential metrics such as IP addresses, hostnames, hop counts, packet loss rates, and latency measurements. Monitoring packet loss, in particular, helps identify issues that require immediate attention.
Traceroute NG is permanently available at no cost, meaning users can utilize its features without concern over expiration or subscription fees. It is compatible with Windows and Windows Server systems, making it a valuable tool for those seeking a straightforward traceroute solution.
-
Lightweight application allows usage across various networks from any device
-
Supports both IPv4 and IPv6, catering to larger and modern network infrastructures
-
Functions as a diagnostic tool for assessing packet loss, latency, and jitter
-
Provides simple visual representations of network data
-
Completely free to use
-
Advanced capabilities, including enterprise-level reporting, are available in more comprehensive tools like SolarWinds Network Performance Monitor
Tracing paths with Traceroute NG is compatible with Windows 8, 8.1, 10, and Windows Server versions 2012 R2 and 2016. Despite being a proprietary tool, it is freely accessible, making it a great choice for those who prefer an alternative to MTR.
Download SolarWinds Traceroute NG at no cost.
PRTG Network Monitor is a powerful platform designed for monitoring network performance, equipped with various features to enhance your network management experience.
This user-friendly, GUI-based tool simplifies network monitoring, making it accessible even for those unfamiliar with command-line interfaces. One of its standout features is the traceroute hop count sensor, which enables users to track the execution time and the number of hops a data packet experiences during its journey across the network. The hop count is visually represented by a clear green dial, providing immediate insights into packet travel distance.
Key functionalities of PRTG include:
-
Automatic network discovery
-
Comprehensive network mapping
-
Traceroute and ping utilities
-
Real-time monitoring capabilities
With PRTG, device discovery is a seamless process, establishing an up-to-date inventory of your network. This system continuously updates, allowing it to recognize any changes, such as the addition or removal of devices. Additionally, it generates a network topology map based on the collected data.
For those concerned with network quality, PRTG offers monitoring for jitter and packet loss. The Quality of Service (QoS) round-trip sensor provides valuable metrics such as jitter, latency, packet loss, and the mean opinion score (MOS) for your network connection.
PRTG is adaptable for businesses of any size, allowing users to purchase a set number of sensors and selectively activate them. The minimum purchase starts at 500 sensors, making it suitable for smaller enterprises. Notably, if only 100 sensors are activated, there are no costs associated with the package.
Additional features include:
-
A combination of packet sniffing, WMI, and SNMP for performance reporting and device discovery
-
Instant autodiscovery that reflects real-time inventory changes
-
An intuitive drag-and-drop editor for creating custom views and reports
-
Support for various alert methods, including SMS, email, and third-party integrations
-
Availability of a freeware version
-
A comprehensive feature set that may require some time to master
Similar to MTR, PRTG Network Monitor is available for free, with options to expand your monitoring capabilities through additional sensors, including those for packet sniffing and NetFlow analysis.If you're relying on tools like ping or traceroute, transitioning to MTR can enhance your network diagnostics.
MTR merges the functionalities of both tools, providing a comprehensive solution for analyzing network routes.
To get you started, we’ve compiled a straightforward guide on utilizing MTR, highlighting essential steps for generating and interpreting reports.
Regardless of your operating system, MTR maintains user-friendly features across the board.
Should MTR not meet your needs, alternatives like Traceroute NG and PRTG Network Monitor are available.
Traceroute NG operates similarly, allowing users to inspect ICMP and TCP data.
On the other hand, PRTG is a holistic network monitoring tool, incorporating a traceroute sensor that visualizes the traditional text-based results of traceroute and MTR.
When conducting an MTR test, you're essentially running the program to analyze the pathway from your local machine to a chosen destination, which can be specified as an IP address or domain name.
MTR stands for Matt’s Traceroute, although some users interpret it as My Traceroute.
The core functionality of MTR utilizes the Internet Control Message Protocol (ICMP), a network layer protocol that does not involve ports.
However, you can configure MTR to utilize UDP with the command mtr -u , beginning tests at port 33000 and incrementing the port number with each subsequent test.
Alternatively, you can instruct MTR to use TCP by specifying the desired port number with mtr -p
It’s important to note that while MTR is effective in reporting packet loss and identifying potential issues along the connection route, it does not resolve these packet loss problems.
Detecting intermittent packet loss can be complex, often requiring multiple MTR runs to identify the issue accurately.
Ultimately, while MTR can reveal packet loss, it does not provide a solution for fixing it.
What is a Netflix VPN and How to Get One
A Netflix VPN is a virtual private network that enables users to access region-restricted content on Netflix by connecting to servers situated in various countries. By using a reliable VPN provider that supports streaming, users can bypass geographical limitations and enjoy a broader range of content. The process involves creating an account with the VPN provider, downloading and installing their application, connecting to a server in the desired region, and then logging in to Netflix to explore and enjoy the expanded library of shows and movies.
Why Choose SafeShell as Your Netflix VPN?
If you're looking to access region-restricted content via a Netflix VPN, you may want to consider the SafeShell VPN . SafeShell VPN offers a multitude of benefits that make it an excellent choice for streaming netflix unblocked . It features high-speed servers optimized for Netflix, ensuring seamless streaming of your favorite shows and movies without interruptions. With cutting-edge technology, these servers deliver lightning-fast connection speeds for buffer-free playback and high-definition streaming, elevating your viewing experience to new heights.
Moreover, SafeShell VPN allows you to connect up to five devices simultaneously, supporting various operating systems like Windows, macOS, iOS, Android, Apple TV, Android TV, and Apple Vision Pro. This ensures that you can enjoy your favorite content on any device of your choice. The exclusive App Mode feature is another standout, allowing you to unlock and enjoy content from multiple regions at once, giving you the freedom to explore a wide range of streaming services and libraries. Additionally, SafeShell VPN provides top-level security with its proprietary "ShellGuard" VPN protocol, offering advanced encryption and robust security features to protect your online privacy, ensuring safe and secure browsing sessions.
A Step-by-Step Guide to Watch Netflix with SafeShell VPN
To use SafeShell Netflix VPN for accessing Netflix content from different regions, follow these steps:
-
Subscribe to SafeShell VPN by visiting their website, choosing a plan that suits your needs, and clicking "Subscribe Now."
-
Download and install the SafeShell VPN app by selecting your device from their website and downloading the appropriate version.
-
Launch the SafeShell VPN app and log in to your account. Opt for the APP mode to enhance your Netflix experience.
-
Browse through the list of available VPN servers, select one from the region whose Netflix content you want to access, and click "Connect" to establish the connection.
-
Finally, open Netflix either through the app or website, log into your account, and start enjoying the content available in the region you selected.